Prometheus
CrowdSec can expose a prometheus endpoint for collection (on http://127.0.0.1:6060/metrics by default). You can edit the listen_addr in config.yaml to allow an external Prometheus to scrape the metrics.
The goal of this endpoint, besides the usual resources consumption monitoring, aims at offering a view of CrowdSec "applicative" behavior :
- is it processing a lot of logs ? is it parsing them successfully ?
- are a lot of scenarios being triggered ?
- are a lot of IPs banned ?
- etc.
All the counters are "since CrowdSec start".
Metrics levels
The prometheus configuration accepts a level parameter that controls the verbosity of exposed metrics. The possible values are:
none: no metrics are registeredaggregated: only aggregated metrics are registered (per-machine and per-bouncer LAPI metrics, per-node parser metrics, decision/alert gauges, and LAPI response time are not available)full(default) : all metrics are registered
Acquisition metrics are registered per datasource — they only appear when the corresponding datasource is configured.
Metrics details
Scenarios
cs_buckets: number of buckets that currently exist (Gauge, labels:name)cs_bucket_instantiation_total: total number of instantiation of each scenario (Counter, labels:name)cs_bucket_overflowed_total: total number of overflow of each scenario (Counter, labels:name)cs_bucket_underflowed_total: total number of underflow of each scenario — bucket was created but expired because of lack of events (Counter, labels:name)cs_bucket_canceled_total: total number of canceled buckets (Counter, labels:name)cs_bucket_poured_total: total number of events poured to each scenario (Counter, labels:source,type,name)
example
#2030 lines from `/var/log/nginx/access.log` were poured to `crowdsecurity/http-scan-uniques_404` scenario
cs_bucket_poured_total{name="crowdsecurity/http-scan-uniques_404",source="/var/log/nginx/access.log",type="nginx"} 2030
Parsers
cs_node_hits_total: how many times an event from a specific source was processed by a parser node (Counter, labels:source,type,name,stage,acquis_type)
example
# 235 lines from `auth.log` were processed by the `crowdsecurity/dateparse-enrich` parser
cs_node_hits_total{name="crowdsecurity/dateparse-enrich",source="/var/log/auth.log",type="syslog",stage="s01-parse",acquis_type="file"} 235
cs_node_hits_ko_total: how many times an event from a specific source was unsuccessfully parsed by a specific parser (Counter, labels:source,type,name,stage,acquis_type)
example
# 2112 lines from `error.log` failed to be parsed by `crowdsecurity/http-logs`
cs_node_hits_ko_total{name="crowdsecurity/http-logs",source="/var/log/nginx/error.log",type="nginx",stage="s01-parse",acquis_type="file"} 2112
-
cs_node_hits_ok_total: how many times an event from a specific source was successfully parsed by a specific parser (Counter, labels:source,type,name,stage,acquis_type) -
cs_node_wl_hits_total: how many times an event was processed by a whitelist node (Counter, labels:source,type,name,reason,stage,acquis_type) -
cs_node_wl_hits_ok_total: how many times an event was successfully whitelisted by a node (Counter, labels:source,type,name,reason,stage,acquis_type) -
cs_parser_hits_total: how many times an event from a source has hit the parser (Counter, labels:source,type) -
cs_parser_hits_ok_total: how many times an event from a source was successfully parsed (Counter, labels:source,type,acquis_type) -
cs_parser_hits_ko_total: how many times an event from a source was unsuccessfully parsed (Counter, labels:source,type,acquis_type)
Processing
cs_parsing_time_seconds: time spent parsing a line (Histogram, labels:type,source)cs_bucket_pour_seconds: time spent pouring an event to buckets (Histogram, labels:type,source)
Decisions & Alerts
cs_active_decisions: number of active decisions (Gauge, labels:reason,origin,action)cs_alerts: number of alerts, excluding CAPI (Gauge, labels:reason)
Application Security Engine
cs_appsec_reqs_total: total events processed by the Application Security Engine (Counter, labels:source,appsec_engine)cs_appsec_block_total: total events blocked by the Application Security Engine (Counter, labels:source,appsec_engine)cs_appsec_rule_hits: count of triggered rules (Counter, labels:rule_name,type,appsec_engine,source)cs_appsec_parsing_time_seconds: time spent processing a request by the Application Security Engine (Histogram, labels:source,appsec_engine)cs_appsec_inband_parsing_time_seconds: time spent processing a request by the inband Application Security Engine (Histogram, labels:source,appsec_engine)cs_appsec_outband_parsing_time_seconds: time spent processing a request by the outband Application Security Engine (Histogram, labels:source,appsec_engine)
Acquisition
Acquisition metrics are split by datasource. They only appear when the corresponding datasource is configured. The following metrics are available :
Cloudwatch
cs_cloudwatch_openstreams_total: number of opened streams within group (Gauge, labels:group)cs_cloudwatch_stream_hits_total: number of events read from stream (Counter, labels:group,stream)
Docker
cs_dockersource_hits_total: total lines that were read (Counter, labels:source)
Files
cs_filesource_hits_total: total lines that were read (Counter, labels:source)
HTTP
cs_httpsource_hits_total: total lines that were read from HTTP source (Counter, labels:path,src)
Journald
cs_journalctlsource_hits_total: total lines that were read (Counter, labels:source)
Kafka
cs_kafkasource_hits_total: total lines that were read from topic (Counter, labels:topic)
Kinesis
cs_kinesis_stream_hits_total: number of events read per stream (Counter, labels:stream)cs_kinesis_shards_hits_total: number of events read per shard (Counter, labels:stream,shard)
Kubernetes Audit
cs_k8sauditsource_hits_total: total number of events received by k8s-audit source (Counter, labels:source)cs_k8sauditsource_requests_total: total number of requests received (Counter, labels:source)
Loki
cs_lokisource_hits_total: total lines that were read (Counter, labels:source)
S3
cs_s3_hits_total: number of events read per bucket (Counter, labels:bucket)cs_s3_objects_total: number of objects read per bucket (Counter, labels:bucket)cs_s3_sqs_messages_total: number of SQS messages received per queue (Counter, labels:queue)
Syslog
cs_syslogsource_hits_total: total lines that were received (Counter, labels:source)cs_syslogsource_parsed_total: total lines that were successfully parsed by the syslog server (Counter, labels:source,type)
VictoriaLogs
cs_victorialogssource_hits_total: total lines that were read (Counter, labels:source)
Windows EventLog
cs_winevtlogsource_hits_total: total events that were read (Counter, labels:source)
Local API
cs_lapi_route_requests_total: number of calls to each route per method (Counter, labels:route,method)cs_lapi_machine_requests_total: number of calls to each route per method grouped by machines (Counter, labels:machine,route,method)cs_lapi_bouncer_requests_total: number of calls to each route per method grouped by bouncers (Counter, labels:bouncer,route,method)cs_lapi_decisions_ko_total: number of calls to /decisions that returned nil result (Counter, labels:bouncer)cs_lapi_decisions_ok_total: number of calls to /decisions that returned non-nil result (Counter, labels:bouncer)cs_lapi_request_duration_seconds: response time of LAPI (Histogram, labels:endpoint,method)
Cache
cs_cache_size: entries per cache (Gauge, labels:name,type)cs_regexp_cache_size: entries per regexp cache (Gauge, labels:name)
Info
cs_info: Information about CrowdSec (software version)
More ways to learn

Watch a short series of videos on how to observe and monitor CrowdSec.
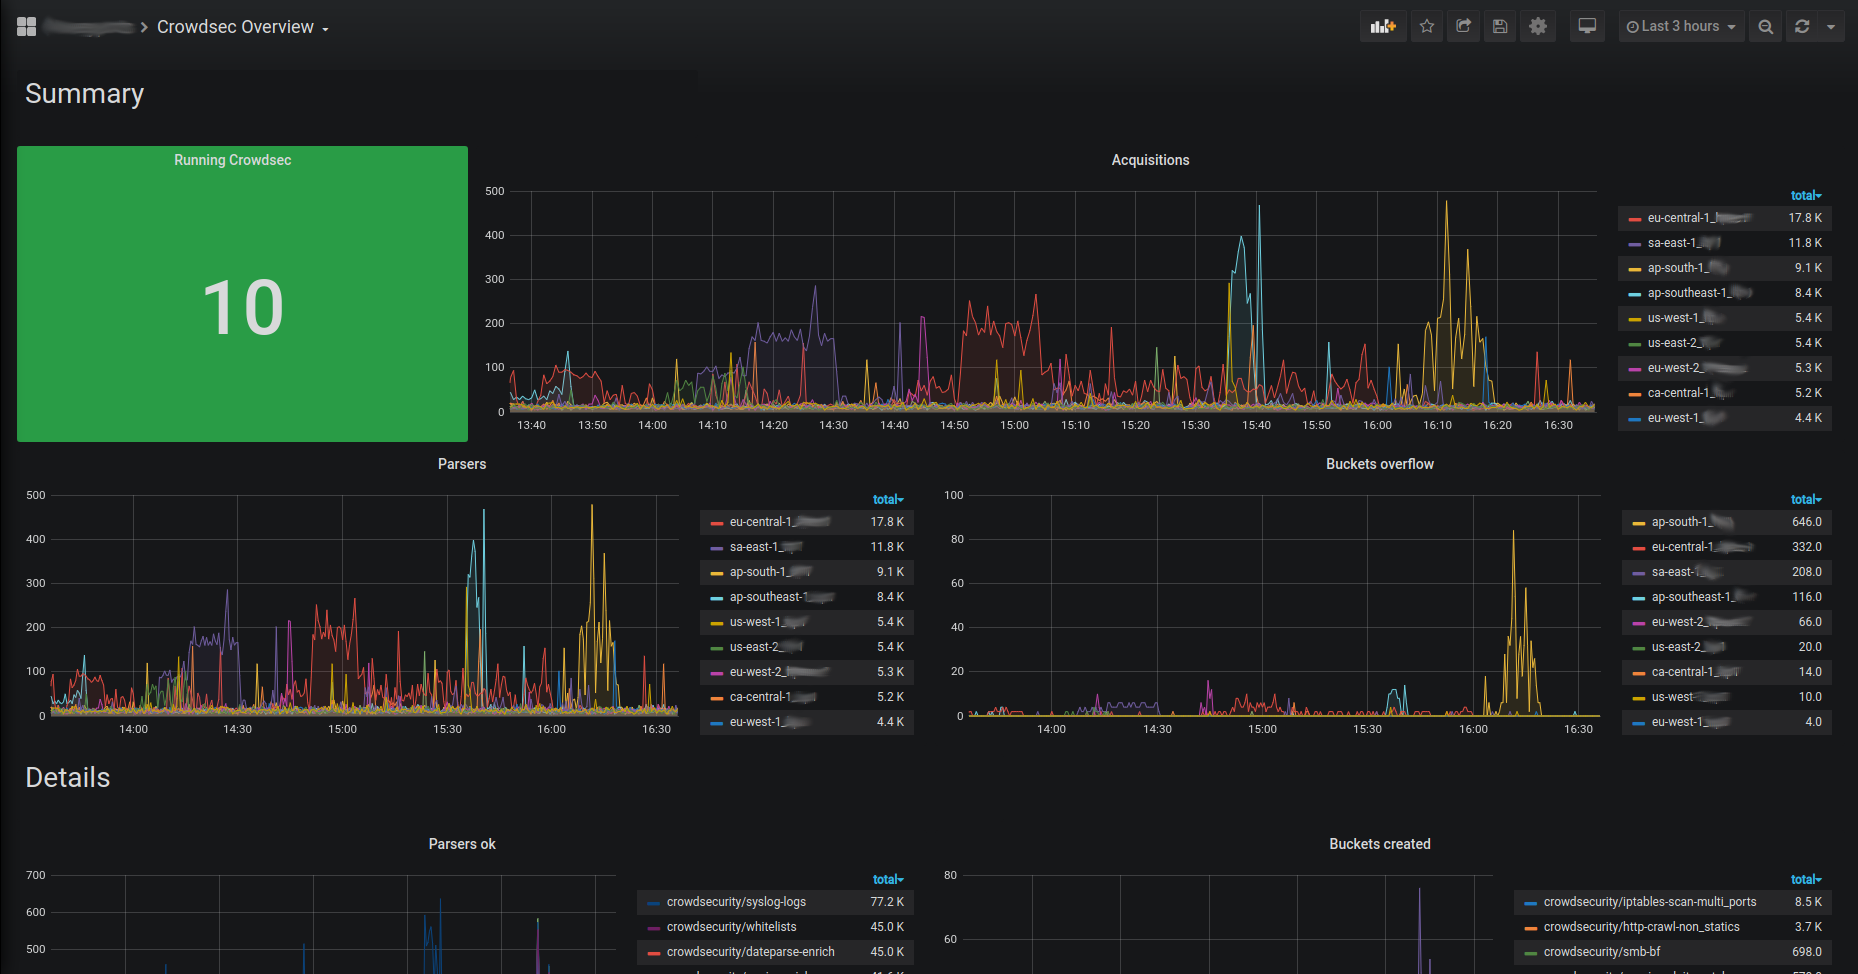
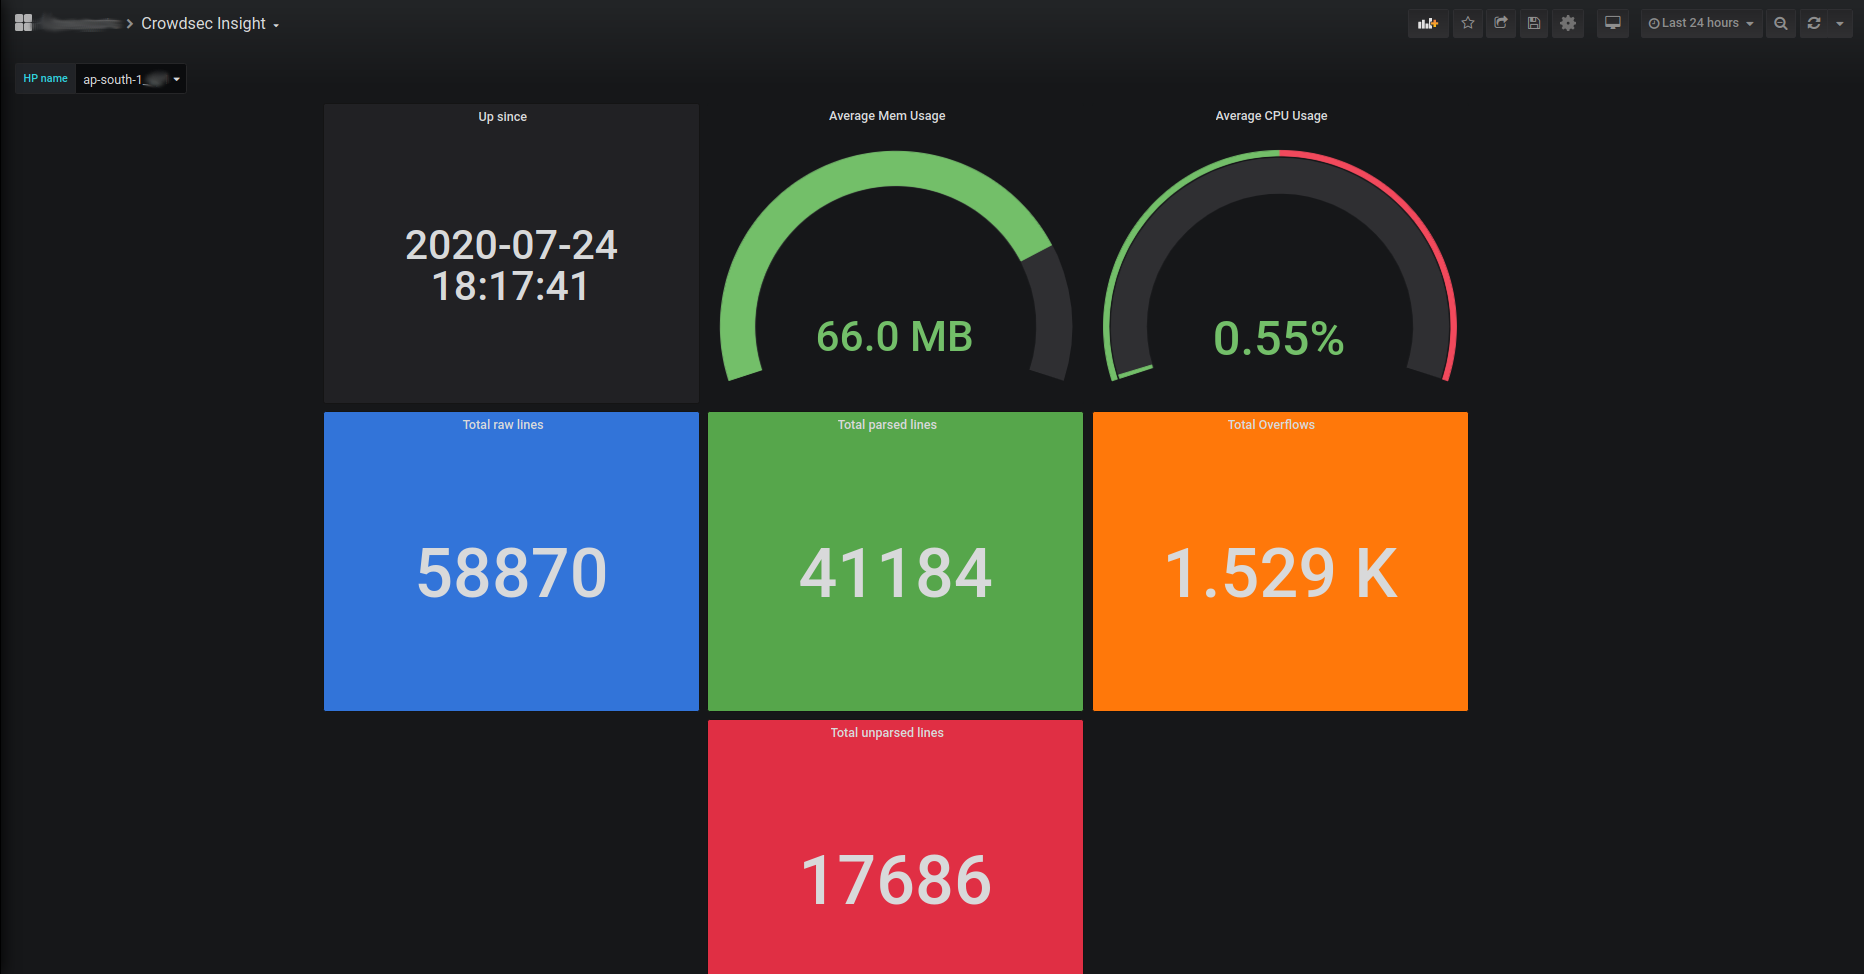
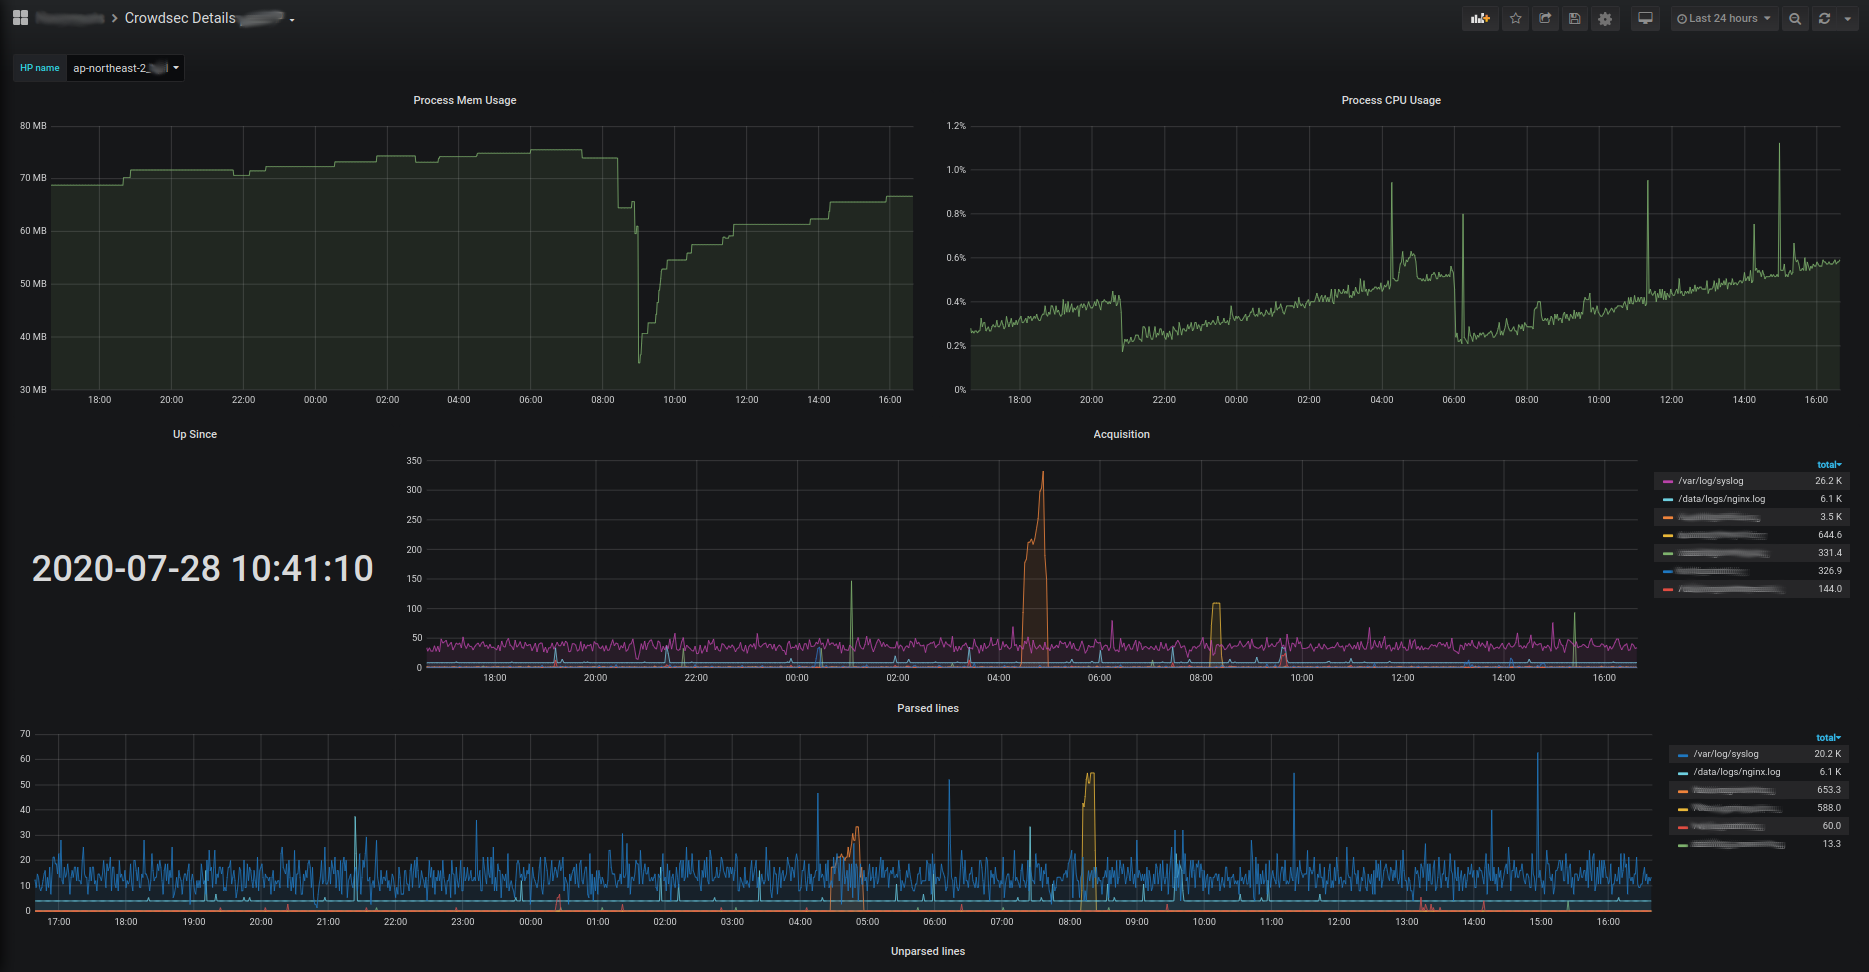
Learn with CrowdSec AcademyExploitation with prometheus server & grafana
Those metrics can be scraped by prometheus server and visualized with grafana. They can be downloaded here :